For anyone with panels already on the roof
Is your solar system producing what it should?
Sunnix tells you every day. And when something is wrong, it tells you why. No sensors, no electrician, no box to mount on a wall: your address and the nameplate data are enough.
Tuesday 12 July
Below the range
What it produced
8.0kWh
Likely cause: dirty modules. Sixty-eight days since the last wash, no useful rain.
It cost you today
€2.15
If nothing changes, in a month
€64.38
The measured figure inside a reference range, like a lab report. That is all there is to it: no chart to interpret.
01The problem
Your inverter tells you how much you produced. Not how much you should have.
Manufacturer portals show you a curve and a total. Good day, bad day. But bad compared to what?
Monday 11 July
On track
What it produced
14.6kWh
Nothing to report: the gap sits inside the margin the model declares. Days like this raise no alert at all.
Tuesday 12 July
Below the range
What it produced
8.0kWh
Likely cause: dirty modules. Sixty-eight days since the last wash, no useful rain.
It cost you today
€2.15
If nothing changes, in a month
€64.38
Same system, two consecutive days. On the left the marker falls inside the expected band and there is nothing to say; on the right it falls outside, and that is when Sunnix speaks. Your inverter's portal would draw the same two columns without the band — that is, without the one thing that tells the two days apart.
02The cost
What it costs you, and whether it's worth fixing.
Spotting the problem is half the job. The other half is knowing whether it's worth spending to solve it — and sometimes the answer is no.
Worth fixing
If a fault is suspected
A fault does not heal itself: every day that passes is a straight loss, and the drop has been running for 12 days. A €150 job pays for itself beyond 70 days at this rate — and a fault lasts until someone finds it.
- If it stays this way, in a month
- €64.38
- The job pays for itself in
- 70 days
Worth waiting
If it's only the modules being dirty
Rain washes them for free, and in 3 days there will be enough of it. Between now and then you lose €6.44: far less than a cleaning. Sunnix tells you to wait — and in the days after, the band shows you whether it worked.
- A cleaning would cost
- €150
- Between now and the rain
- €6.44
The €150 is an example, there to show the arithmetic: it is not our price list — cleaning and inspection are quoted on the system you actually have. The arithmetic is the real one, and the product runs it with the figure you give it.
03How it works
Three steps, then it works on its own.
Five minutes to start. From there Sunnix checks your system every day, and writes to you only when there's something to know.
- 1
Create the system
Address and nameplate data, from your phone. No sensors, no electrician, nothing to mount on the wall.
- 2
Connect the production
If your inverter is among the connectable ones it links by itself and brings its history. Otherwise upload a CSV, or type one number a day.
- 3
On day one you see the past
Sunnix re-reads the days already gone and tells you how the system has performed so far, and what problems it had without anyone noticing.
Portals you can connect today
- SolarEdge
- Huawei FusionSolar
- Zucchetti ZCS
- SolaX
That is the whole list, and it is a short one. Fronius, SMA and Enphase are not there yet: it grows according to what people ask for.
Your inverter is not on the list?
Tell us the make and model you have. Integrations get added in that order — whatever people ask for — and without the requests we decide by guesswork. In the meantime the CSV or the API key make the comparison work just the same.
04The alert
What reaches you, and when.
You don't have to open anything. If the day sits inside the expected band you get nothing; when it falls outside, this is what arrives.
Sunnix
Villa Rossi — how yesterday went
Worth a look
The system is producing far less than expected
What it produced
8.0kWh
What it should have produced
15.4kWh
Yesterday it produced 52% of what it should have, a gap far wider than the ±21% margin we declare. That's €2.15 lost in a single day, and around €64.38 a month if it stays this way.
Before calling anyone: the top of the day's page lists the checks you can run from the ground, in five minutes and without tools. Plenty of bad days end there.
See the dayTuesday 13 July
7:41

Sunnix
now
Yesterday the system produced far less
Likely cause: dirty modules. The day cost €2.15.
The same thing as a phone notification, if you want it. Keep only the email, only the notifications, or both.
It fires when the problem starts
At onset, not every day it lasts. An alert that repeats until you fix it gets silenced within a week, and from then on it is useless — including on the day it would have had something to tell you.
It never fires for bad weather
A week of rain is not a fault, and the twin knows it because that weather is already in the calculation. If the day was bad for everyone, the expected figure drops along with the real one and there is nothing to report.
05What you get
What you get, every day.
Forty seconds on your phone in the morning. It is not a dashboard to study.
The daily comparison
Expected and produced, every day, with the range that says if it's fine.
Anomalies, with a cause
When it leaves the range it tells you why, and what it costs you.
The five-day forecast
A five-day forecast, and the best hours to use power.
The system logbook
Cleanings, faults and costs in one place. Three PDFs come out of it.
Milestones and scenarios
The first MWh, the payback, what it has yielded since day one.
06Afterwards
You found the problem. Now what?
Knowing you are losing €64.38 a month helps little if you are then left on your own. Sunnix walks you through it in order, from what costs nothing to what costs.
First
The checks you can do yourself
They sit at the top of the anomaly card: things you can do from the ground, in five minutes, without tools and without climbing anywhere. Many bad days end right here.
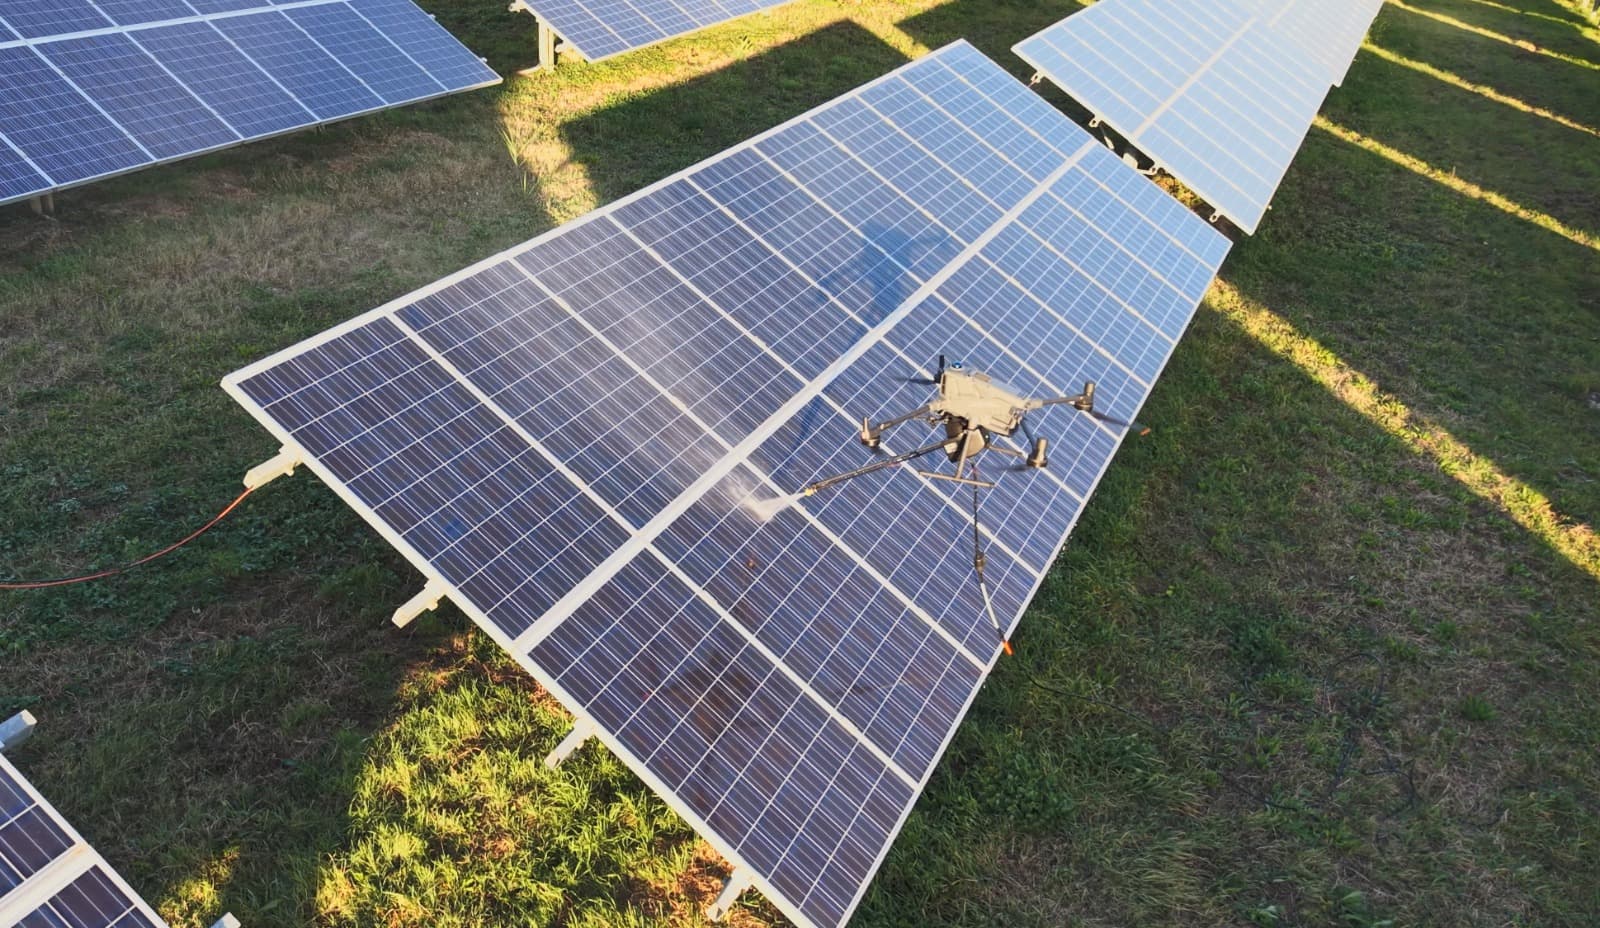
If a cleaning is needed
Drone cleaning
No scaffolding and nobody working at height: that is why it works even on a pitched roof seven metres up. Sunnix tells you whether it is worth doing now or waiting for rain — and in the second case it really does say so.
See the service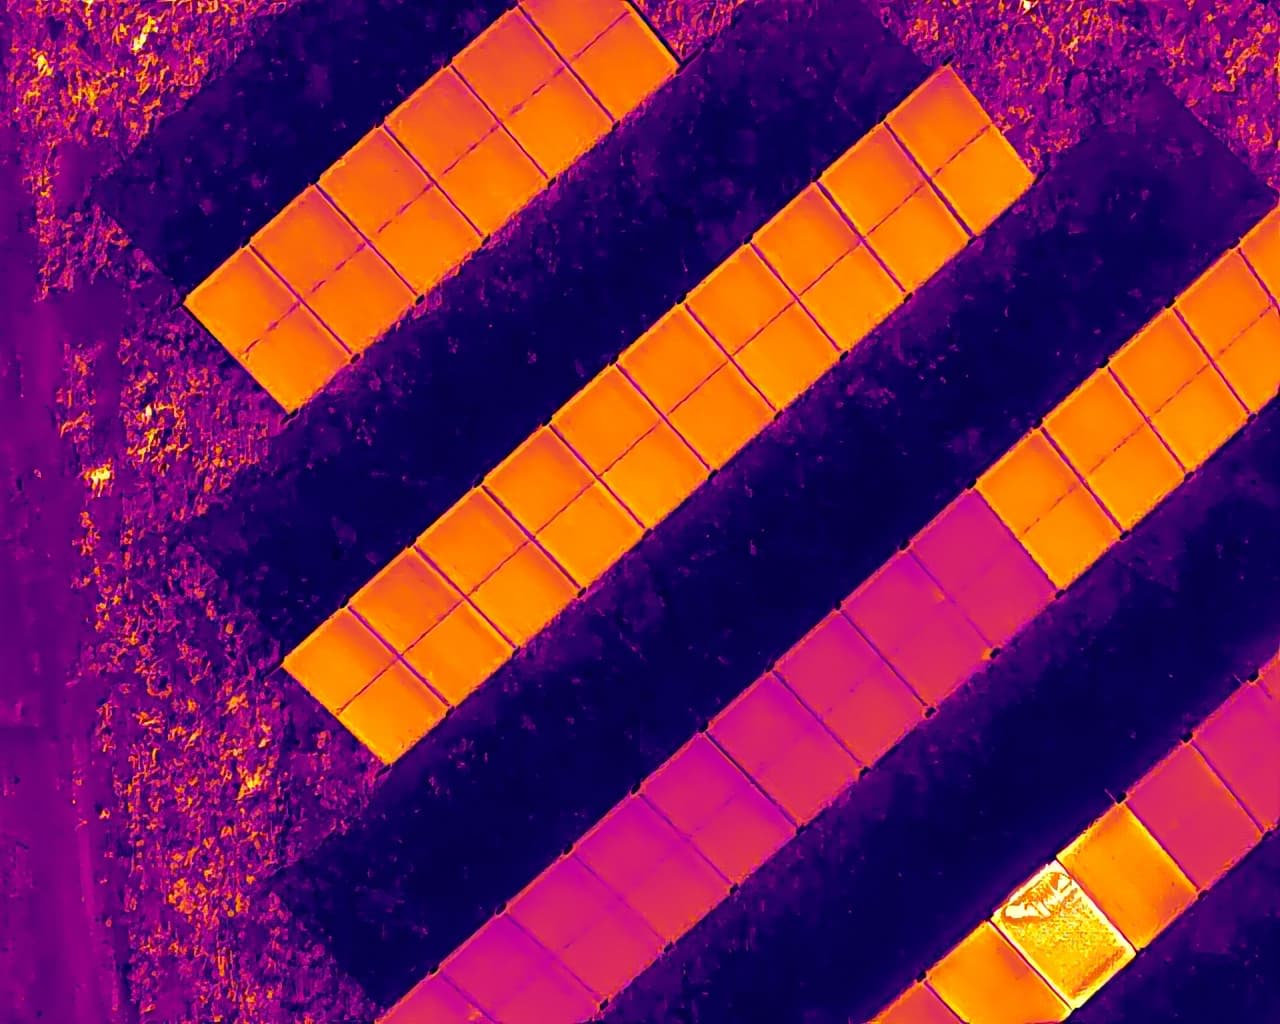
If a fault is suspected
Thermographic inspection
When the gap is not dirt and not shade, you look where the eye cannot: a hot module, a dead cell, a string that is not working. Radiometric diagnostics certified to ISO 9712 and IEC 62446-3.
See the service
Whichever route you take, the work goes into the system logbook — with the date and the cost — and over the following days you see on the range whether it helped.
07The price
It pays for itself on the first bad day.
One bad day, if it stays that way for a month
€64.38
The check that spots it, for a month
€4.90
The bad day is the example at the top of the page, not a market average.
The plan follows the system's power, you don't pick it
Starter
up to 6 kWp included
€4.90a month
Plus
above 6 and up to 15 kWp
€9.90a month
Business
above 15 and up to 50 kWp
€24.90a month
Above 50 kWp
Write to us and we will talk: we quote on the system you actually have.
What you see before paying
You create the system and Sunnix tells you straight away what it would produce in a typical year on that roof. It is an estimate over an average climate year: what does yours do? If some seem to be missing, from there we cannot tell you whether it is a fault or just the weather — for that we need your history, and that is the part you pay for.
When it actually starts working
Calibration is included in the subscription and happens as soon as you activate: if your inverter is one of the connectable ones the history comes from there, otherwise you upload it as a CSV. Either way the margin narrows immediately and there is nothing to wait for. The «some weeks» only apply if no history exists at all — a system just switched on, or a portal you cannot export from.
If you are buying as a company, enter your SDI code (or PEC) and VAT number at checkout for electronic invoicing.
08Why trust it
An honest tool, even when it doesn't suit you.
Sunnix was born inside Solink, which has worked in solar for years: the same surveys, the same thermography, the same cleaning you see above are things we do in the field. The daily check exists because the question we are asked most is a single one — «is my system performing well?» — and we had no honest way to answer it.
The margin is stated
A model that has never seen your system's real production works to roughly ±21 per cent, and inside that margin a fifteen per cent drop is invisible: we do not pretend otherwise. That is exactly why calibration on your history is included in the subscription and happens on day one — that margin is a starting condition, not where we leave you.
Estimated and measured are never mixed
The kWh that come out of the model stay an estimate until a real reading confirms them. They are written differently, always, even when mixing them would be more convenient.
Sometimes it tells you not to spend
If waiting for rain beats paying for a cleaning, it says so. And when a case is uncertain it says «I don't know» rather than inventing a diagnosis. That is exactly why you can believe it when it does tell you to spend.
No certifications we do not hold
The definitions follow IEC 61724-1; conformity does not. That would need an irradiance sensor installed on site, and there is none. And we do not call the ratio of real to expected production a Performance Ratio, because it is not one.
Activate the check on your system
You need the address and the nameplate data: five minutes. No electrician, no opening the switchboard, nothing to buy first.
A question before you start? Write to us