Documentation
Configuration guide
Design your custom system. Maximum geometric precision and total control over components and obstacles.
What is Configuration?
The configurator is the advanced tool for designing the system taking into account the actual roof geometry.
Unlike simulation, here you can draw every single panel, manage obstacles (chimneys, skylights), and define distances from edges with precision.
- Google Solar API (Auto) · SUGGESTED
- Leverage Google AI to automatically detect slopes, tilt, and obstacles, speeding up the drawing process.
- Manual Drawing
- Draw everything from scratch. Ideal if satellite maps are outdated or if you wish to have millimeter control over every vertex.
Phase 1: Initial Setup
Before accessing the graphic editor, there are three steps common to both modes.
1
Data Entry and API Choice
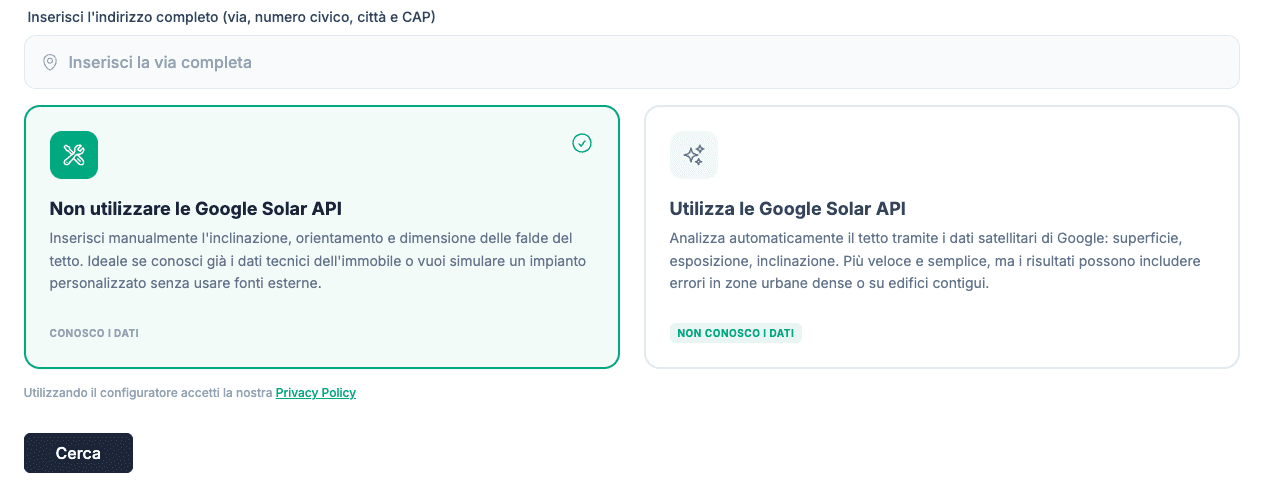
Enter the full address (street, number, city, and zip code). You will need to choose whether to activate Google Solar API.
2
Building Confirmation
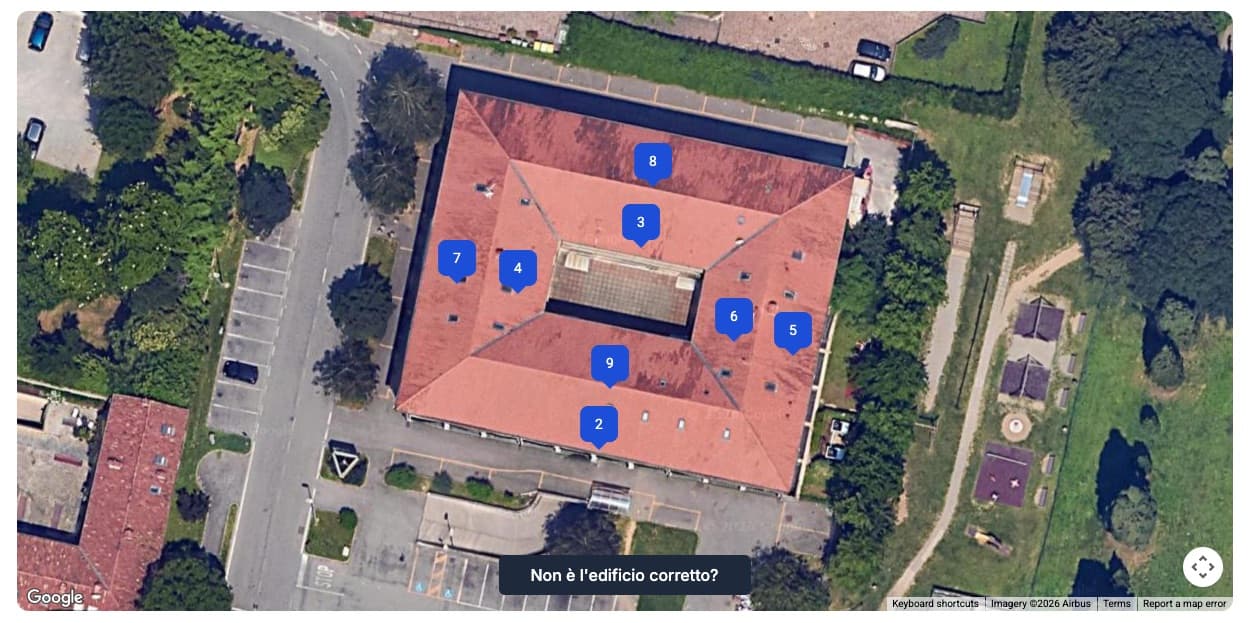
The map with the identified building will be displayed. Make sure the highlighted building is the correct one. If not, click on the correct building on the map to select it.
If you use Google Solar API:
You will also see the automatic division of slopes and related data, ordered by exposure (from South to North).
If there are slopes you don't want to use, delete them immediately with the trash icon.
3
Power and Panel
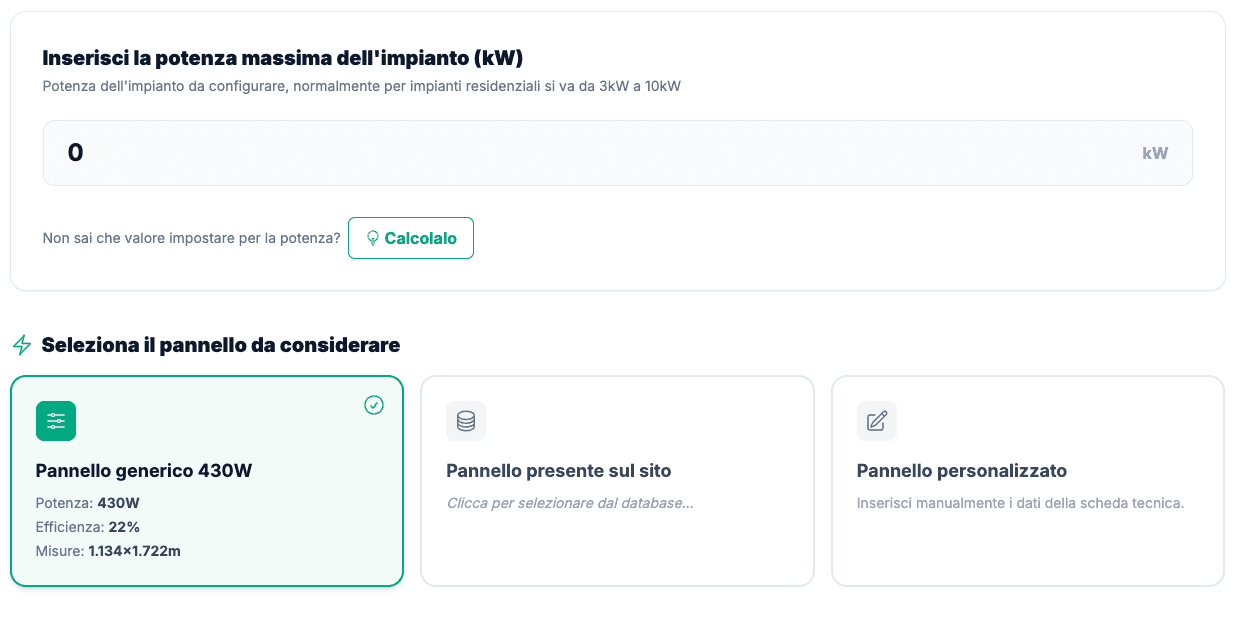
1. Power Goal (Optional):
- If you set a power (e.g., 6kW):
- This will be the maximum installable power. The drawing will stop automatically as soon as that threshold is reached.
- If you do NOT set a power:
- The drawing will continue until you stop it manually (in manual mode) or until you have filled all available slopes (in Google mode).
2. Panel Choice:
Select the photovoltaic module. By default, a generic 430W panel is set, but you can access the database of partner manufacturers or manually enter the specifications of a custom panel.
How to use the Sunnix Editor
The operation changes slightly depending on the chosen mode. Select the one you activated to see the correct guide:
1
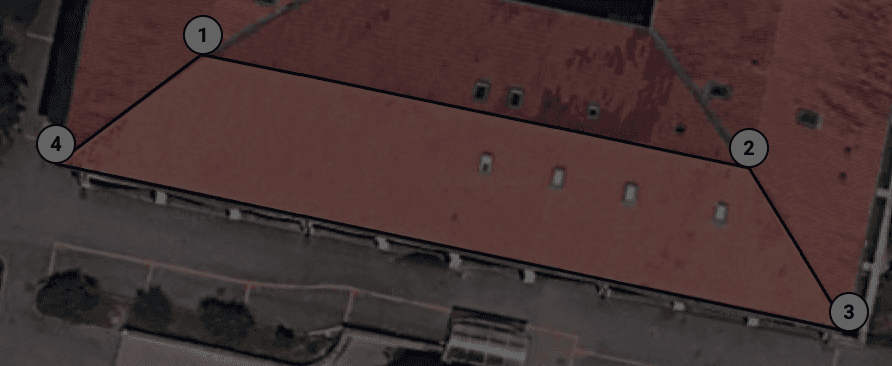
Perimeter Drawing
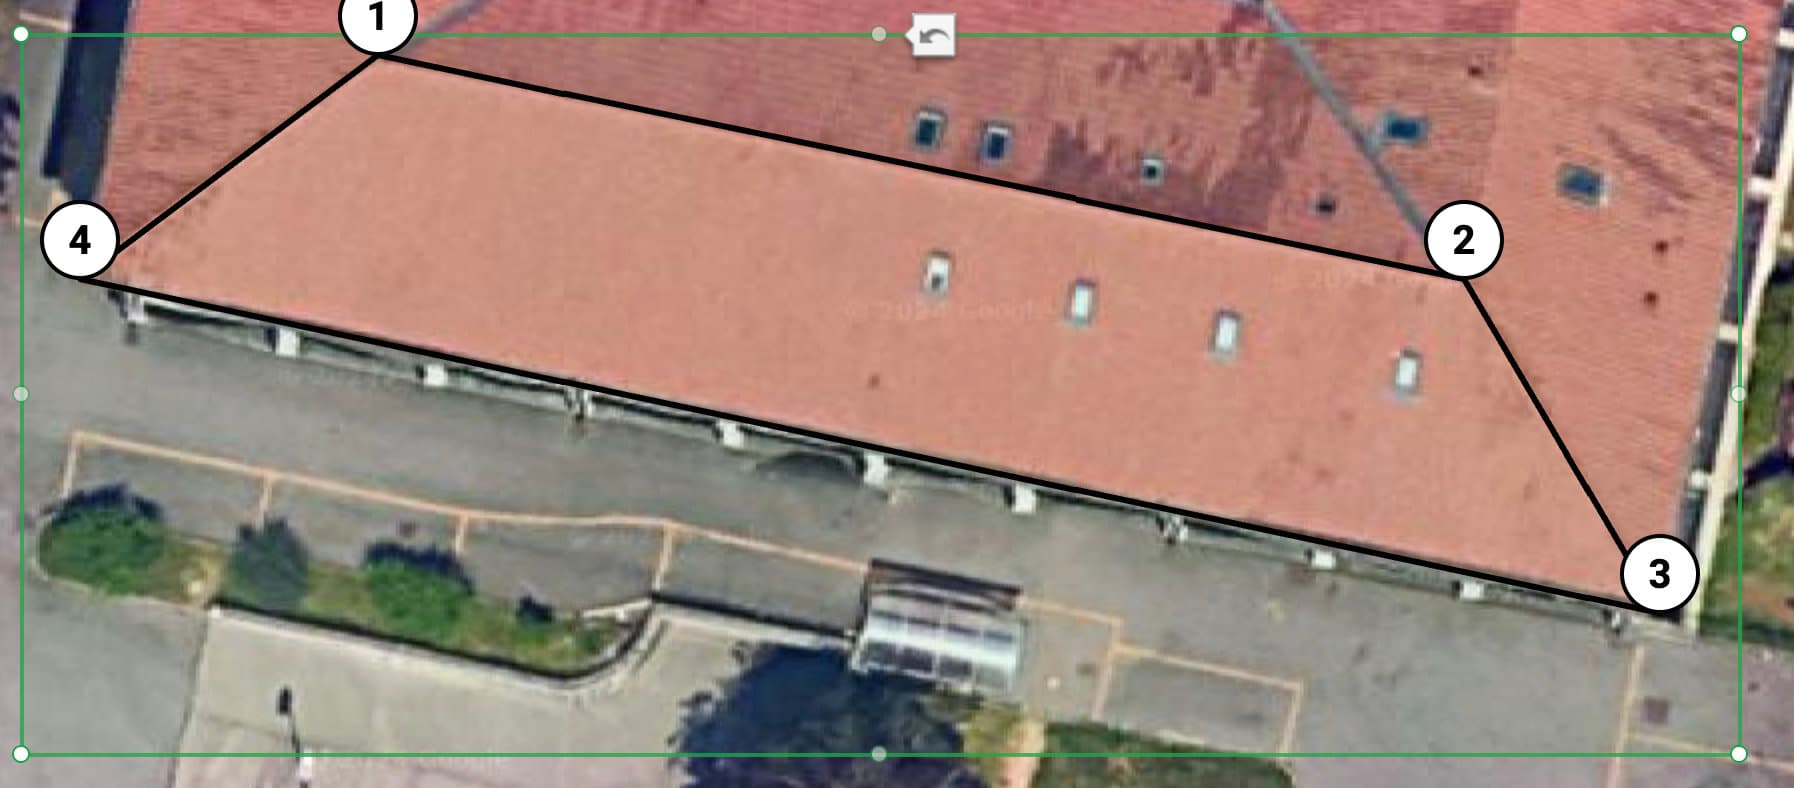
You will see a green rectangle (bounding box) that delimits the slope area recognized by Google Solar API.
2
Eave Selection
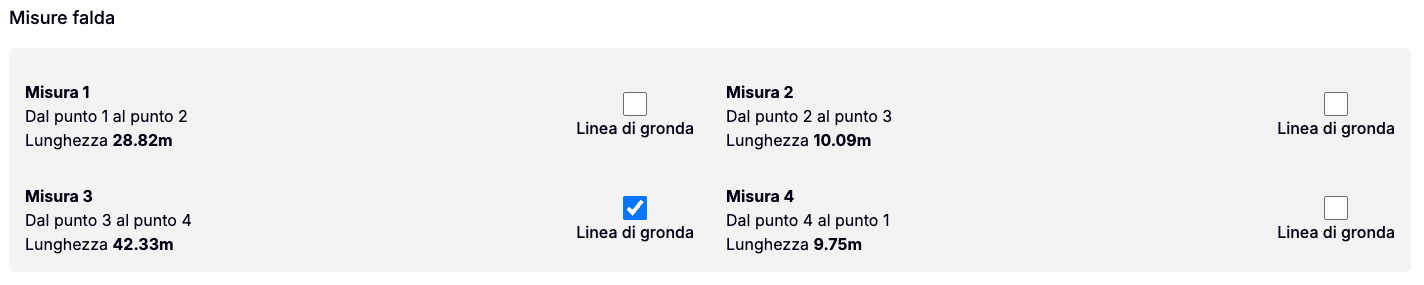
Once the perimeter is closed, click on the side corresponding to the eave. This allows the software to align panels correctly.
3
Panel Positioning
- Free Mode
- Position panels manually where you prefer inside the perimeter.
- Automatic Mode
- The algorithm fills the space optimizing it. You can still exclude zones ("obstacles" like chimneys or skylights) and choose module orientation (landscape or portrait) relative to the eave.

Estimated time: 5 minutes
Ready to draw your system?
Nothing else needed. Enter your data, draw the slopes, and immediately get the full report of your system.
No registration required